Full Trust European Hosting

BLOG about Full Trust Hosting and Its Technology - Dedicated to European Windows Hosting Customer

Visual Studio Hosting - HostForLIFE.eu :: VS Code Auto-Format Code on Save to Simplify Your Processes

clock October 30, 2024 09:27 by author Peter

For any developer, keeping code neat and orderly is essential, but worrying about formatting all the time can interfere with productivity. What if your code could be formatted automatically each time you hit save? This post will discuss a straightforward yet effective feature in Visual Studio Code (VS Code) that handles formatting for you with a single click.

Step-by-Step Guide: Enabling Format on Save
The magic of auto-formatting in VS Code lies in the "Format on Save" feature. Here's how you can enable it.

  • Open Visual Studio Code: Launch VS Code on your system.
  • Navigate to Settings: Click on `File` in the top menu, then select `Preferences` -> `Settings`.
  • Search for Format on Save: In the search bar, type "save" to filter the settings related to saving files. Look for the option labeled Format On Save. Look in the below image.

  • Enable the Feature: Check the box next to "Format On Save" to enable the feature.
    If you haven't selected a default formatter, VS Code will prompt you to choose one when you enable "Format on Save." You can pick from the available formats installed in your environment. For example, if you have Prettier installed, you can select it as your default formatter. Simply choose the one that suits your needs, and VS Code will use it to format your code every time you save.

The Magic of Auto-Formatting
Once you've enabled "Format on Save," you can write code without worrying about the formatting. Whether you're pasting in code snippets, writing redundant code, or simply speeding through a task, VS Code will ensure everything is clean and organized the moment you hit `CTRL+S`.

For example, imagine you write a block of redundant/dirty JavaScript code like this before Save click.

Without manually adjusting spaces or aligning braces or formatting, simply press `CTRL+S`, and VS Code will automatically format it.

See the magic; now, every time you click on save it'll automatically restructure the whole code.

Why Use Format on Save?

  • Consistency: Ensure consistent code style across your project without manual intervention.
  • Time-Saving: Focus more on logic and less on formatting, as VS Code handles the latter for you.
  • Error Reduction: Properly formatted code is easier to read and debug, reducing the likelihood of syntax errors.

Conclusion
With VS Code's "Format on Save" feature, you can keep your code neat and tidy with minimal effort. It’s a small setting that makes a big difference, letting you code faster and smarter. No need for additional tools—just code, save, and let VS Code do the rest. Give it a try, and experience the magic of auto-formatting in your next coding session.

Thanks a Lot, Everyone! Is this guide helpful? Give it a thumbs up and share it with your fellow developers! Your support keeps the tips and tricks coming.
Happy coding!


European Visual Studio Hosting - HostForLIFE :: Use .http files in Visual Studio

clock February 15, 2024 07:13 by author Peter

You can send HTTP queries and test APIs straight from Visual Studio by using.http files. Visual Studio 2019 and later versions support this capability.

Before this feature, how are your APIs tested?

  • Swagger
  • Postman
  • Unit testing

How can a.http file be used in our project?
Let me explain how we can use a.http file to test an API.
Get a new.NET 8 API project started. This is how it appears by default; it was made with.NET 8.

What does this file intend to accomplish?
Testing ASP.NET Core and API projects without the need for third-party setup, such as Swagger, is possible with the http file editor.

How is it useful to us?

  • Make a request.
  • transmits the HTTP requests listed in the.httpfiles.
  • shows the answers

How does this file appear?
By default, this file contains the weather forecast API code.

The rate (@) sign allows us to use and add a new variable.

To indicate to this file that the previous API has ended and that there will be another API following it, three hashtags (###) are used as delimiters.
How can we make an API call or send a request?

Right-click anywhere inside the.http file and choose "Send Request" to start the request. The request will be sent by Visual Studio, and the output pane will show the response.

We can add other requests for other HTTP Methods like (OPTIONS, HEAD, POST, PATCH, DELETE, TRACE). You can also include request headers, request bodies, and query parameters in your .http file. Visual Studio will automatically highlight syntax errors and provide suggestions for valid HTTP methods, headers, and more.

Using .http files in Visual Studio can greatly simplify the process of testing APIs and debugging HTTP requests. It allows you to quickly iterate and validate your API calls without leaving the IDE.

Note. (.http files) are specific to Visual Studio and are not part of the .NET Core framework itself. They are a convenient tool provided by Visual Studio for API testing and development.


European Visual Studio Hosting - HostForLIFE :: Boosting Your Productivity with .NET Core CLI Commands

clock September 12, 2023 09:47 by author Peter

In this post, I'll show you how to increase your productivity using.NET Core CLI Commands and how to use.NET Core CLI (Command Line Interface) commands to assist developers speed up their work with a few tips and tricks. We can create, build, add packages, restore packages, run apps, and deploy Core applications using the.Net CLI. I'll go over basic operations like establishing new projects, compiling and running programs, managing dependencies, and working with NuGet packages.

Increasing Productivity with the Command Line Interface in Visual Studio
When we develop a new application in Visual Studio, we use.Net CLI commands internally to create, build, add packages, launch, and deploy apps.

When you install the.NET Core SDK, the.NET Core CLI is also installed by default. As a result, no additional installation is required.CLI for Net Core.
How can I tell if.Net CLI is installed or not?

Open Run and type CMD.

When the command prompt appears, type dotnet and press enter.

CLI Command Syntax: dotnet command> argument> option>
Take note that all commands begin with dotnet. The syntax shown above will assist developers in executing essential instructions from the command-line interface. Let's use the first command (dotnet help) to get help for all commands.

How do I obtain a complete list of all.Net Core commands?


List of all .Net Core commands

Below is a list of all .Net core commands that will appear once we run the "dotnet help" command. Let's list down all commands as below with a short description of what each does.

SDK commands

  • add:  Add a package or reference to a .NET project
  • build: Build a .NET project
  • build-server: Interact with servers started by a build
  • clean: Clean build outputs of a .NET project
  • format: Apply style preferences to a project or solution
  • help: Show command line help
  • list: List project references of a .NET project
  • msbuild: Run Microsoft Build Engine (MSBuild) commands.
  • new: Create a new .NET project or file.
  • NuGet: Provides additional NuGet commands.
  • pack: Create a NuGet package.
  • publish: Publish a .NET project for deployment
  • remove: Remove a package or reference from a .NET project.
  • restore: Restore dependencies specified in a .NET project.
  • run: Build and run a .NET project output.
  • SDK: Manage .NET SDK installation.
  • sln: Modify Visual Studio solution files.
  • store: Store the specified assemblies in the runtime package store.
  • test: Run unit tests using the test runner specified in a .NET project.
  • tool: Install or manage tools that extend the .NET experience.
  • vstest:  Run Microsoft Test Engine (VSTest) commands.
  • workload: Manage optional workloads.

How to create a new console project?
Let's create a new console project using the "dotnet new" Command.
dotnet new console -n MyConsoleAppUsingCLI -o C:\Users\XXXXX\projects\MyConsoleAppUsingCli

Once the above Command runs successfully, We are able to create a console application with the name "MyConsoleAppUsingCli" at the given path "C:\Users\XXXXX\projects\". Let's build the newly created project using the build command.

Build Command: dotnet build C:\Users\peter\projects\MyConsoleAppUsingCli\

Once we run the build command, As per the above screen, the project build succeeded.

How to add a package reference to the new console application?
Let's add a package reference to the new console application using the add package CLI command.


We have added the package "Microsoft.EntityFrameworkCore" to our project. Let's open our console app in Visual Studio and check the newly added package reference in the solution.

As per the above screen, We are able to see Microsoft.EntityFrameworkCore package reference was added successfully.

Run the project using Run CLI Command

Run project using Run CLI Command: dotnet run --project C:\Users\peter\projects\MyConsoleAppUsingCli\MyConsoleAppUsingCli.csproj

In this article, I have demonstrated how to boost productivity with Visual Studio's command-line interface. CLI is very powerful and is used for developing, running, and publishing applications. We have covered essential commands like creating new projects, compiling and running applications, managing dependencies, and handling NuGet packages in console applications. Here I have explained the basic commands required to set up a project and run the new project, but you can explore more on other commands and leverage the power of the.NET Core CLI for streamlined and productive development projects.


European Visual Studio 2017 Hosting - HostForLIFE :: Test HTTP API Endpoint without Postman using Visual Studio

clock June 5, 2023 09:46 by author Peter

You can now test our API endpoints using Visual Studio 17.5 with the aid of Visual Studio. Let's begin with an implementation example.


Step 1
Create a new Web API project using.NET Core.

Step 2

Create one API controller and multiple endpoints within the new project, which will be tested using an HTTP file.
using Microsoft.AspNetCore.Mvc;
using RudderStackDemo.Entities;
using RudderStackDemo.Repositories;

namespace RudderStackDemo.Controllers
{
    [Route("api/[controller]")]
    [ApiController]
    public class ProductsController : ControllerBase
    {
        private readonly IProductService _productService;

        public ProductsController(IProductService productService)
        {
            _productService = productService;
        }

        /// <summary>
        /// Product List
        /// </summary>
        /// <returns></returns>
        [HttpGet]
        public async Task<IActionResult> ProductListAsync()
        {
            var productList = await _productService.ProductListAsync();
            if (productList != null)
            {
                return Ok(productList);
            }
            else
            {
                return NoContent();
            }
        }

        /// <summary>
        /// Get Product By Id
        /// </summary>
        /// <param name="productId"></param>
        /// <returns></returns>
        [HttpGet("{productId}")]
        public async Task<IActionResult> GetProductDetailsByIdAsync(int productId)
        {
            var productDetails = await _productService.GetProductDetailByIdAsync(productId);
            if (productDetails != null)
            {
                return Ok(productDetails);
            }
            else
            {
                return NotFound();
            }
        }

        /// <summary>
        /// Add a new product
        /// </summary>
        /// <param name="productDetails"></param>
        /// <returns></returns>
        [HttpPost]
        public async Task<IActionResult> AddProductAsync(ProductDetails productDetails)
        {
            var isProductInserted = await _productService.AddProductAsync(productDetails);
            if (isProductInserted)
            {
                return Ok(isProductInserted);
            }
            else
            {
                return BadRequest();
            }
        }

        /// <summary>
        /// Update product details
        /// </summary>
        /// <param name="productDetails"></param>
        /// <returns></returns>
        [HttpPut]
        public async Task<IActionResult> UpdateProductAsync(ProductDetails productDetails)
        {
            var isProductUpdated = await _productService.UpdateProductAsync(productDetails);
            if (isProductUpdated)
            {
                return Ok(isProductUpdated);
            }
            else
            {
                return BadRequest();
            }
        }

        /// <summary>
        /// Delete product by id
        /// </summary>
        /// <param name="productId"></param>
        /// <returns></returns>
        [HttpDelete]
        public async Task<IActionResult> DeleteProductAsync(int productId)
        {
            var isProductDeleted = await _productService.DeleteProductAsync(productId);
            if (isProductDeleted)
            {
                return Ok(isProductDeleted);
            }
            else
            {
                return BadRequest();
            }
        }
    }
}

Step 3
Right-click on the project name in the solution and add the API-Test.http file inside your project.

Step 4
Add different HTTP endpoint requests inside the HTTP file.

GET https://localhost:7178/api/Products

###

@productId = 2
GET https://localhost:7178/api/Products/{{productId}}

###

POST https://localhost:7178/api/Products
Content-Type application/json

{
  "id": 3,
  "productName": "Laptop",
  "productDescription": "HP Pavilion",
  "productPrice": 80000,
  "productStock": 10
}

###

PUT https://localhost:7178/api/Products
Content-Type application/json

{
  "id": 3,
  "productName": "Laptop",
  "productDescription": "DELL",
  "productPrice": 80000,
  "productStock": 10
}

###

DELETE https://localhost:7178/api/Products?productId=1


Step 5
Now you can execute the individual API endpoint after clicking on the run button corresponding to each request as shown below.


European Visual Studio 2017 Hosting - HostForLIFE :: Helpful Tips To Increase Productivity In Visual Studio

clock January 18, 2023 07:23 by author Peter

In this article, I'll show you some Visual Studio features that have greatly boosted developers' efficiency and productivity in their day-to-day development.


Introduction
Visual Studio is an IDE made by Microsoft and used for different types of software development such as computer programs, websites, web apps, web services, and mobile apps. It is used by many developers all over the world every day. It's a fantastic tool with lots of important features that will make the life of a developer much simpler.

Visual Studio supports 36 different programming languages. Several well-known languages that are supported by Visual Studio are C#, F#, Visual Basics, C, C++, Python, JavaScript, etc.

Let’s see how we can speed up development work with some Visual Studio built-in features.

1. Code Snippets
The Code snippets are pre-written templates that enable us to write code for our project more quickly. That can be inserted in a code file using a context menu command or a combination of hotkeys. It is used to add repeating code patterns, such as properties, loops, or conditional statements. Visual Studio has a lot of inbuilt code snippets. We are going to show a few of them which are often used while programming.

Snippets for Properties
To add an auto-implemented property, we have to type the prop key and then press TAB key twice. That will generate the following.

public <TYPE> MyProperty { get; set; } //TYPE can be int, string, bool.. etc.
//Default it will generate int type of propery as below:
public int MyProperty { get; set; }

The TAB key is used to switch between fields, EX: If we want to jump from TYPE to MyProperty or Vice versa, then we can use the TAB key.

Then we can change “TYPE” and "MyProperty":
public string Name { get; set; }

Similarly, if we want to add a full property along with its private variable, we can type propfull.

Other useful Code snippets or shortcuts. Please remember, you have to type <Snippet> TAB + TAB (hit the Tab key twice) to generate code templates.

 if  Generate if statement
 else  Generate else statement
 try  Generate try and catch statement
 tryf  Generate try and finally statement
 for  Generates a for loop
 foreach  Generates a foreach loop
 cw  Generate Console.WriteLine() statement

In Visual Studio, there are numerous built-in code snippets, You can find them all by pressing CTRL+K+X. As shown below image.

2. Code Editor Split
We can split the code editor vertically or horizontally. This is quite helpful If we need to simultaneously edit several related file's code at the same time. To add a new vertical tab group. Open the file in the editor and use the keyboard shortcut Alt + W, V. It will open the file like below.
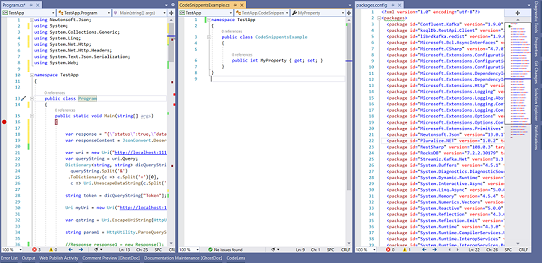
We can spit files horizontally too. It is useful when we need to compare the same file content, To spit files horizontally use Menu Window ⇾ Split option.

Or You simply use the small drag arrows icon in the top right corner of your file window, as shown in the following screenshots.
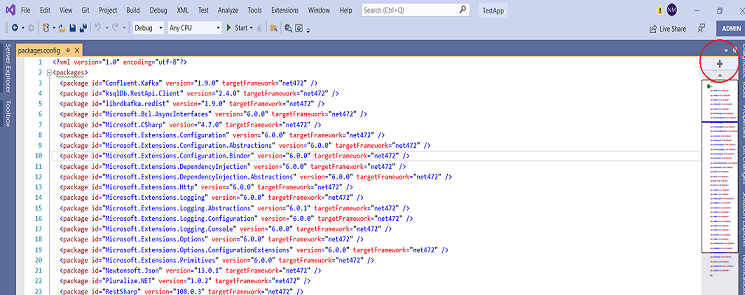
The result will be.
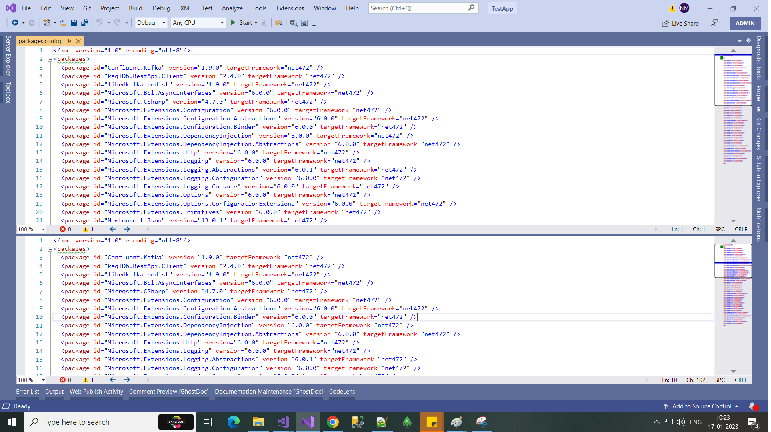
3. Navigation Through the Active Windows and Tabs
To navigate between the active windows in VS. We are using the mouse to go from one window to another.
But, while doing coding, we want to quickly complete any side tasks without taking our hands off the keyboard. Therefore, we can use the CTRL+TAB combination rather than a mouse. Then, using the arrow keys, we can choose the necessary active window:
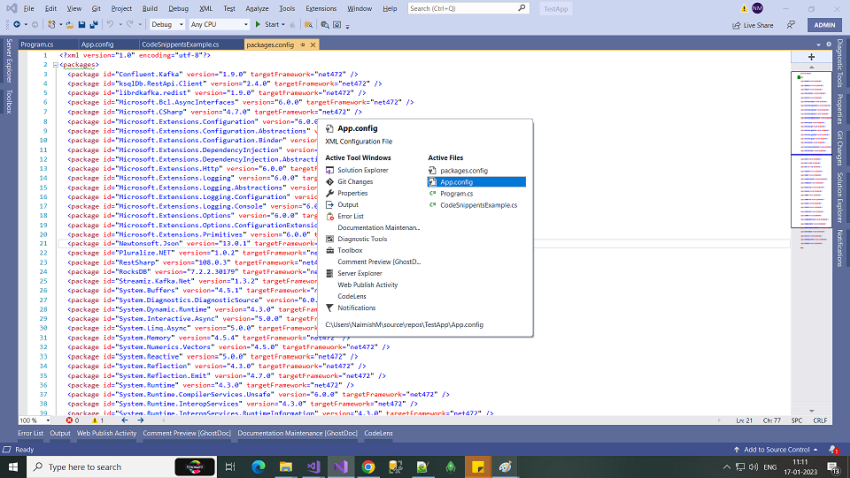
We can navigate through the active tabs in the same way that we do with the active windows. So for that, we need to press the CTRL+TAB keys and navigate with arrow keys. If we don't want to use the arrow key, then we just press the TAB key to navigate through the active tabs.

The same result can also be obtained by using CTRL+F6 or, for reverse navigation, use CTRL+SHIFT+F6.

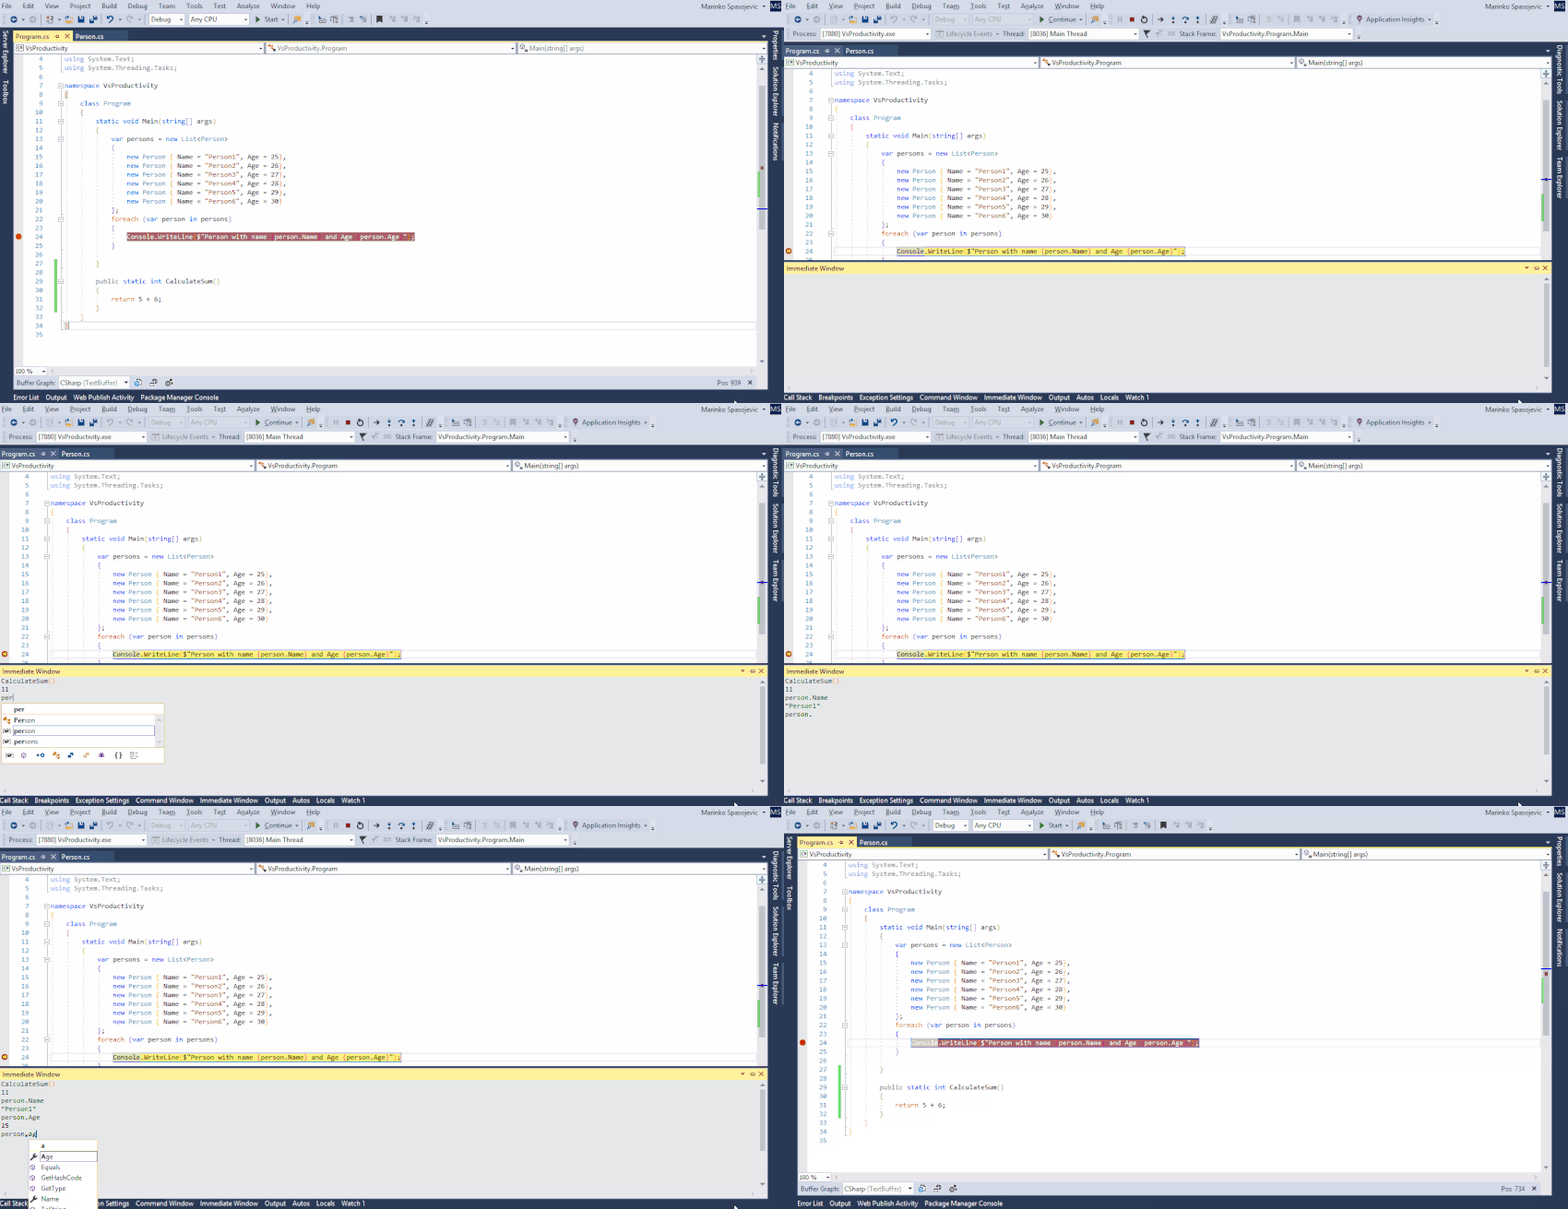
4. Immediate Window
The Immediate window is used to debug and evaluate expressions, execute statements, and print variable values. It allows you to enter expressions to be evaluated or executed by the development language during debugging. We can write additional code that can add to or alter the current code execution.

To display the Immediate window, open a project, and then choose Debug > Windows > Immediate or press Ctrl+Alt+I.

5. Shortcuts
There are a huge number of keyboard shortcuts available in Visual Studio that let you do everything from code navigation to code generation, refactoring, debugging, and more. The most effective method for enhancing Visual Studio productivity and accelerating the coding process is to use keyboard shortcuts.


European Visual Studio 2017 Hosting - HostForLIFE.eu :: Drawing rubber-band lines and shapes in VB.NET

clock June 19, 2020 12:57 by author Peter

 The lack of XOR Drawing feature in GDI+ was not certainly welcome in the programmer's community. I guess it will be hard to survive with this handicap. In spite of this, I would like to show how we can draw rubber-band lines and shapes in GDI+ with just a few lines of code.

     Private Sub Form1_Load(ByVal sender As Object, ByVal e As System.EventArgs) 
    Dim size As Size = SystemInformation.PrimaryMonitorMaximizedWindowSize 
    bitmap = New Bitmap(size.Width, size.Height) 
    gB = Graphics.FromImage(bitmap) 
    Dim bckColor As Color = Me.BackColor 
    gB.Clear(bckColor) 
    End Sub 
    Private Sub Form1_MouseDown(ByVal sender As Object, ByVal e AsSystem.Windows.Forms.MouseEventArgs) 
    Dim p As Point = New Point(e.X, e.Y) 
    x0 = p.X 
    y0 = p.Y 
    drag = True 
    End Sub 
    Private Sub Form1_MouseMove(ByVal sender As Object, ByVal e AsSystem.Windows.Forms.MouseEventArgs) 
    Dim p As Point = New Point(e.X, e.Y) 
    x= p.X 
    y = p.Y 
    Dim cx As Integer = x - x0 
    Dim cy As Integer = y - y0 
    If drag Then 
    Dim gx As Graphics = CreateGraphics() 
    gx.DrawImage(bitmap, 0, 0) 
    gx.Dispose() 
    Dim g As Graphics = CreateGraphics() 
    Dim pen As Pen = New Pen(Color.Blue) 
    Select Case DrawMode 
    Case 1 
    g.DrawLine(pen, x0, y0, x, y) 
    Exit Select 
    Case 2 
    g.DrawEllipse(pen, x0, y0, cx, cy) 
    Exit Select 
    Case 3 
    g.DrawRectangle(pen, x0, y0, cx, cy) 
    Exit Select 
    End Select 
    g.Dispose() 
    pen.Dispose() 
    End If 
    End Sub 
    Private Sub Form1_MouseUp(ByVal sender As Object, ByVal e AsSystem.Windows.Forms.MouseEventArgs) 
    Dim cx As Integer = x - x0 
    Dim cy As Integer = y - y0 
    Dim pen As Pen = New Pen(Color.Blue) 
    Select Case DrawMode 
    Case 1 
    gB.DrawLine(pen, x0, y0, x, y) 
    Exit Select 
    Case 2 
    gB.DrawEllipse(pen, x0, y0, cx, cy) 
    Exit Select 
    Case 3 
    gB.DrawRectangle(pen, x0, y0, cx, cy) 
    Exit Select 
    End Select 
    drag = False 
    pen.Dispose() 
    End Sub 
    Private Sub Form1_Paint(ByVal sender As Object, ByVal e AsSystem.Windows.Forms.PaintEventArgs) 
    Dim gx As Graphics = CreateGraphics() 
    gx.DrawImage(bitmap, 0, 0) 
    gx.Dispose() 
    End Sub 
    Private Sub button1_Click(ByVal sender As Object, ByVal e As System.EventArgs)button1.ForeColor = Color.Red 
    button2.ForeColor = Color.Black 
    button3.ForeColor = Color.Black 
    DrawMode = 1 
    End Sub 
    Private Sub button2_Click(ByVal sender As Object, ByVal e As System.EventArgs) 
    button2.ForeColor = Color.Red 
    button1.ForeColor = Color.Black 
    button3.ForeColor = Color.Black 
    DrawMode = 2 
    End Sub 
    Private Sub button3_Click(ByVal sender As Object, ByVal e As System.EventArgs) 
    button3.ForeColor = Color.Red 
    button1.ForeColor = Color.Black 
    button2.ForeColor = Color.Black 
    DrawMode = 3 
    End Sub 
    Private Sub panel1_Paint(ByVal sender As Object, ByVal e AsSystem.Windows.Forms.PaintEventArgs) 
    button1.ForeColor = Color.Red 
    button1.Focus() 
    End Sub


European Visual Studio 2017 Hosting - HostForLIFE.eu :: Using C# Regions To Improve Code Readability

clock May 17, 2019 09:44 by author Peter

An instructor I once had made a statement that has echoed in my head for years. When you are a programmer, you have two groups of end users, the people who will actually use the software, AND other programmers who may someday have to modify your code. With that in mind, I have always tried to write my code to be as easily readable to other programmers as possible.

Visual Studio .NET gives us some very handy tools to improve readability in our code. One that I am particularly fond of is the #region directive that allows us to collapse code in a customized manor.

Regions are created in this format,
#region MyRegion

your code here
#EndRegion

Everything that falls within the directives will be collapsible.

The method I've chosen to adapt is to create regions for each different type of element in a class (i.e. constructors, variables, methods, properties, enumerators) so that my code can be easily navigated.

Here is an example,

Doing this will keep your code more organized, which in turn will increase efficiency. And someday down the road when another programmer comes across your source code, they will be very thankful.


European Visual Studio 2017 Hosting - HostForLIFE.eu :: Visual Studio Short Keys And Tips

clock March 22, 2019 11:01 by author Peter

Every developer who uses Visual Studio should know or be familiar with the shortcuts which I am going to share here. I hope it will be helpful to the freshers and even the experienced software developer friends.

Visual Studio Shortcut Keys and Tips

  1. Every developer should learn the difference between the concept of running an application in normal mode and in debug mode. Most of the freshers do not know this concept and run the application using F5 or clicking the RUN button in the menu bar of Visual Studio. But when it comes to the performance of Visual Studio and speed, we should know that F5 is used for running the application in debugging mode and for running the application without debugging, it is Ctrl+F5.

    So, in simple words, if the developer wants to start the application in debugging mode, press F5; otherwise press Ctrl+F5.
  2. To put the breakpoints in the code use F9. For this, we have to put the control at the specific line of code and press F9. Debugging is basically used to check the result or see the values which is coming as per expectation. Now if we run the application the control will come to that specific control and then we can see whether the values are coming as per our expectation or not. If it is the method then we have the concept of step in and step out. We use step in  to get into that specific method and to inspect the values in the method; for this we use F11. Step Out is used to see the output of the method, and the F10 key is used.
  3. As a developer, it is very important to write the code in proper format but most of the developers do not follow it (laughing) as their mind and soul waits to complete the task or module. But after some time of development of the code, they feel that the code should be formatted properly for the sake of better understanding and to troubleshoot (i.e debugging). For that purpose Visual Studio has a formatting concept through which we can format the document. To format the document we can use Ctrl+K,d.
  4. Sometimes, we write code which is not used at present but maybe it will  be needed for some other cases or for some specific attribute afterward for any specific conditions. We can comment the code by using Ctrl+K, C which will comment on the selected code.
  5. To remove a comment for the specific code, we can use Ctrl+K, U in Visual Studio.

Hope these small and useful tips will help you guys. I will provide more shortcuts for developers in the next blog.


European Visual Studio 2017 Hosting - HostForLIFE.eu :: How To Organize Classes Using Namespaces?

clock February 13, 2019 10:23 by author Peter

Today, in this article, we shall see what namespace actually does and how to organize the classes using namespaces. We use namespaces to organize classes into a logically related hierarchy. Namespaces function as both an internal system for organizing our application and an external way to avoid name collision between source code and application. Because more than one company may create a class with the same name, such as Employee, when we create code, that may be seen or used by third parties. It’s highly recommended that we shall organize our classes by using a hierarchy of namespaces. By practising this, we can avoid interoperability issues on application.

To create a namespace, we simply type a keyword namespace followed by the name. It is recommended to use Pascal case for namespaces.

It is also recommended that you create at least two-tiered namespaces, which is one that contains two levels of classification, separated by a period.

Let us see sample example of a two-tiered namespace.

namespace Infosys.Sales {  
    //define your classes within the namespace  
    public class customer() {}  
}   

Above two-tiered namespace declaration is identical to writing each namespace in nested format, as shown in the following code. 


namespace CompanyName {  
    namespace Sales {  
        public class Customer() {}  
    }  
}   

In both cases, we refer to class by using the following code.

CompanyName.Sales.Customer();   

Note

We should avoid creating a class with the same name as namespace.

Commonly used namespaces in .NET Framework
Microsoft .NET Framework is made of many namespaces, the most important one being System. The System namespace contains classes that most of the applications use to interact with operating system.

For example, the system namespace contains the console class which provides several methods, including WriteLine, which is a command that enables us to write code to an on-screen console.

We can access WriteLine method of console as follows.

System.Console.WriteLine("Prem Kumar Rathrola");   

A few of other namespaces that are provided by .NET Framework through the system namespace are listed below. 

  • System.Windows.Forms
    Provides the classes that are useful for building applications based on windows. 
  • System.IO
    Provides classes for reading and writing data to files

  • System.Data
    Provides classes that are useful for data access

  • System.Web
    Provides classes that are useful for building web forms applications


European Visual Studio 2017 Hosting - HostForLIFE.eu :: Shortcuts For Debugging In Visual Studio

clock November 28, 2018 10:06 by author Peter

Debugging is one of the most important aspect of programming. It is crucial to successful software development, but even many experienced programmers find it challenging. With the help of keyboard shortcuts , it can be made faster. So here is the list of all shortcut keys available in visual studio for debugging.

Debugging Shortcuts in Visual Studio
 

Shortcut

Description

Ctrl-Alt-V, A Displays the Auto window to view the values of variables currently in the scope of the current line of execution within the current procedure
Ctrl-Alt-Break Temporarily stops execution of all processes in a debugging session. Available only in run mode
Ctrl-Alt-B Displays the Breakpoints dialog, where you can add and modify breakpoints
Ctrl-Alt-C Displays the Call Stack window to display a list of all active procedures or stack frames for the current thread of execution. Available only in break mode
Ctrl-Shift-F9 Clears all of the breakpoints in the project
Ctrl-Alt-D Displays the Disassembly window
Ctrl-F9 Enables or disables the breakpoint on the current line of code. The line must already havek a breakpoint for this to work
Ctrl-Alt-E Displays the Exceptions dialog
Ctrl-Alt-I Displays the Immediate window, where you can evaluate expressions and execute individual commands
Ctrl-Alt-V, L Displays the Locals window to view the variables and their values for the currently selected procedure in the stack frame
Ctrl-Alt-M, 1 Displays the Memory 1 window to view memory in the process being debugged. This is particularly useful when you do not have debugging symbols available for the code you are looking at. It is also helpful for looking at large buffers, strings, and other data that does not display clearly in the Watch or Variables window
Ctrl-Alt-M, 2 Displays the Memory 2 window
Ctrl-Alt-M, 3 Displays the Memory 3 window
Ctrl-Alt-M, 4 Displays the Memory 4 window
Ctrl-Alt-U Displays the Modules window, which allows you to view the .dll or .exe files loaded by the program. In multiprocess debugging, you can right-click and select Show Modules for all programs
Ctrl-B Opens the New Breakpoint dialog
Ctrl-Alt-Q Displays the Quick Watch dialog with the current value of the selected expression. Available only in break mode. Use this command to check the current value of a variable, property, or other expression for which you have not defined a watch expression
Ctrl-Alt-G Displays the Registers window, which displays CPU register contents
Ctrl-Shift-F5 Terminates the current debugging session, rebuilds if necessary, and then starts a new debugging session. Available in break and run modes
Ctrl-Alt-N Displays the Running Documents window that displays the set of HTML documents that you are in the process of debugging. Available in break and run modes
Ctrl-F10 Starts or resumes execution of your code and then halts execution when it reaches the selected statement. This starts the debugger if it is not already running
Ctrl-Shift-F10 Sets the execution point to the line of code you choose
Alt-NUM * Highlights the next statement to be executed
F5 If not currently debugging, this runs the startup project or projects and attaches the debugger. If in break mode, this allows execution to continue (i.e., it returns to run mode).
Ctrl-F5 Runs the code without invoking the debugger. For console applications, this also arranges for the console window to stay open with a “Press any key to continue” prompt when the program finishes
F11 Executes code one statement at a time, tracing execution into function calls
Shift-F11 Executes the remaining lines of a function in which the current execution point lies
F10 Executes the next line of code but does not step into any function calls
Shift-F5 Available in break and run modes, this terminates the debugging session
Ctrl-Alt-V, T Displays the This window, which allows you to view the data members of the object associated with the current method
Ctrl-Alt-H Displays the Threads window to view all of the threads for the current process
F9 Sets or removes a breakpoint at the current line
Ctrl-F11 Displays the disassembly information for the current source file. Available only in break mode
Ctrl-Alt-W, 1 Displays the Watch 1 window to view the values of variables or watch expressions
Ctrl-Alt-W, 2 Displays the Watch 2 window
Ctrl-Alt-W, 3 Displays the Watch 3 window
Ctrl-Alt-W, 4 Displays the Watch 4 window
Ctrl-Alt-P Displays the Processes dialog, which allows you to attach or detach the debugger to one or more running processes


About HostForLIFE.eu

HostForLIFE.eu is European Windows Hosting Provider which focuses on Windows Platform only. We deliver on-demand hosting solutions including Shared hosting, Reseller Hosting, Cloud Hosting, Dedicated Servers, and IT as a Service for companies of all sizes.

We have offered the latest Windows 2016 Hosting, ASP.NET Core 2.2.1 Hosting, ASP.NET MVC 6 Hosting and SQL 2017 Hosting.


Tag cloud

Sign in